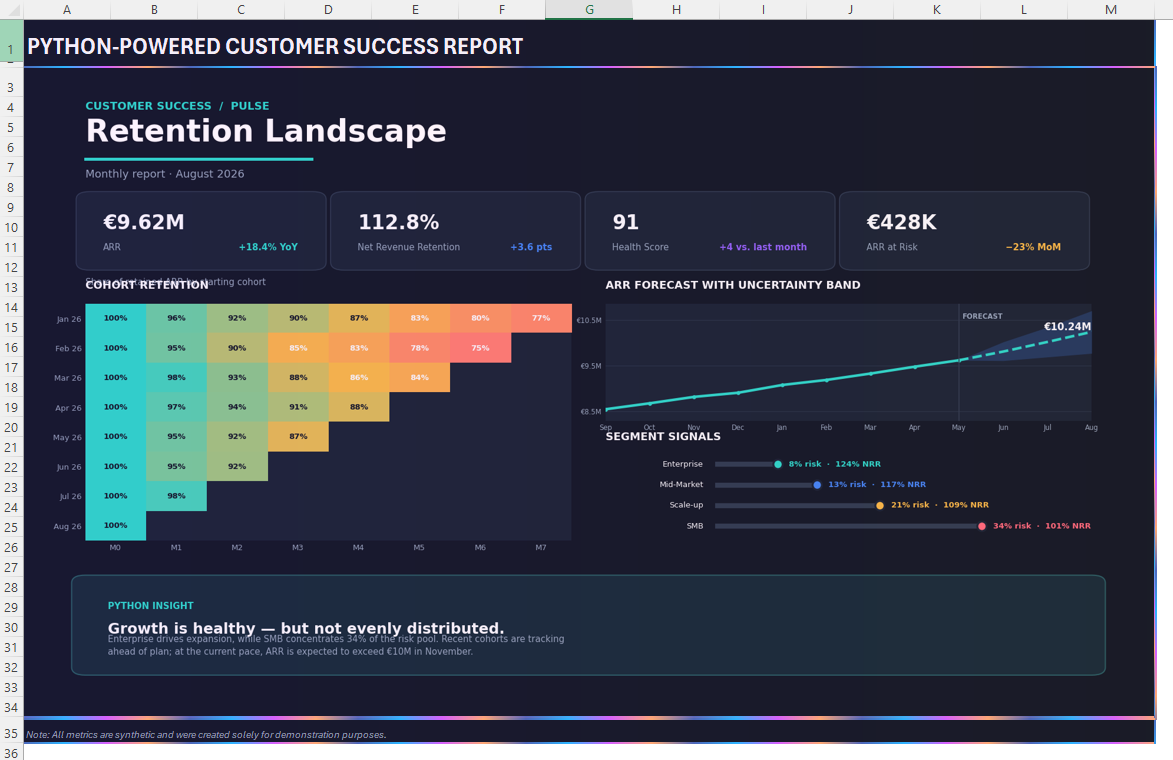
Some questions push past what a formula can comfortably answer: a forecast across several quarters, a significance test, a grouping of customer records, a type of chart Excel simply doesn’t offer. In cases like those, you can now just ask Copilot. Describe in plain language what you want to know, and Copilot writes the Python code behind the scenes, runs it, and puts the result into your workbook. You don’t need to know how to program. Microsoft documented the feature at the end of August for Windows, Mac and the web. Here’s how to use it, and what happens to your data when you do.
 Benefit: Analysis without the expertise
|
 UseCase: Making sense of data
|
 Reading time:
3 minutes |
 Difficulty: Easy
|
Overview
How to get started
- Open the workbook holding the data you want to look at, either in the browser or in the desktop app.
- Start Edit with Copilot.
- Describe what you’re after in plain language – “summarise the trends over the past twelve months”, say, or “give me a box plot of sales by region”. If you specifically want Python, mention it.
- Check the result in your workbook. If the analysis has landed there as a Python cell, you’ll spot it by the =PY() function – though you never have to read the code inside it.